-
Dynamic range module use
The Dynamic Range module is capable of measuring the ability of a digital product to record a scene with a certain exposure time and a very dark or bright ambient light. Currently, iQstest only supports dynamic range detection of a single image.
In the main interface of the software, click the "Dynamic Range Test Card" navigation button, the right side will display the currently supported dynamic range card:
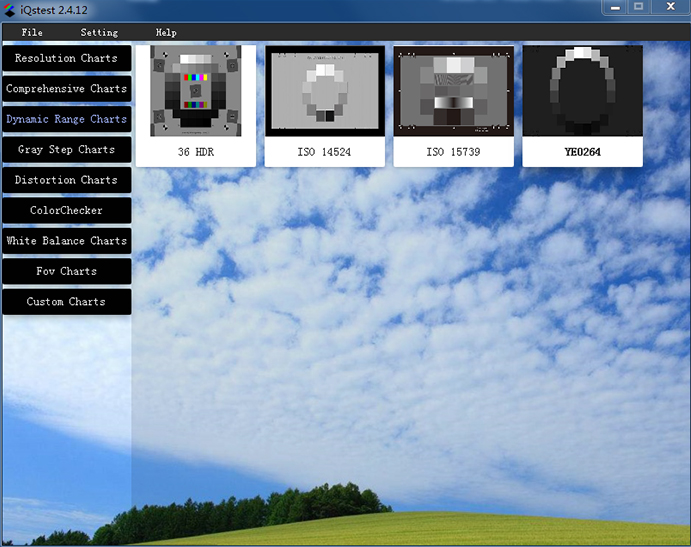
Figure 3.3.1 Dynamic Range Test CardHere is an example of a 36-step dynamic range card. Click on the 36-step dynamic test card thumbnail in the above figure to enter the configuration page:
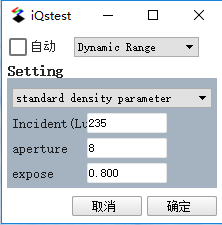
Figure 3.3.2 Dynamic Range Configuration
Detailed configuration:
The 36-step dynamic range configuration is divided into two sections:
1, module test selection: 36-order dynamic range supports both automatic analysis (check "automatic"), but also supports manual analysis (do not select "automatic");
2. Setting section: There are three ways to import grayscale ring density:
1) default density parameter;
2) manual input density;
3) obtain density file path from configuration file;
specify “incident light”, “aperture”, “exposure” when shooting, used to calculate sensitivity (based on saturation sensitivity) , standard output sensitivity);automatic
Click "确认" to open the file selection box:
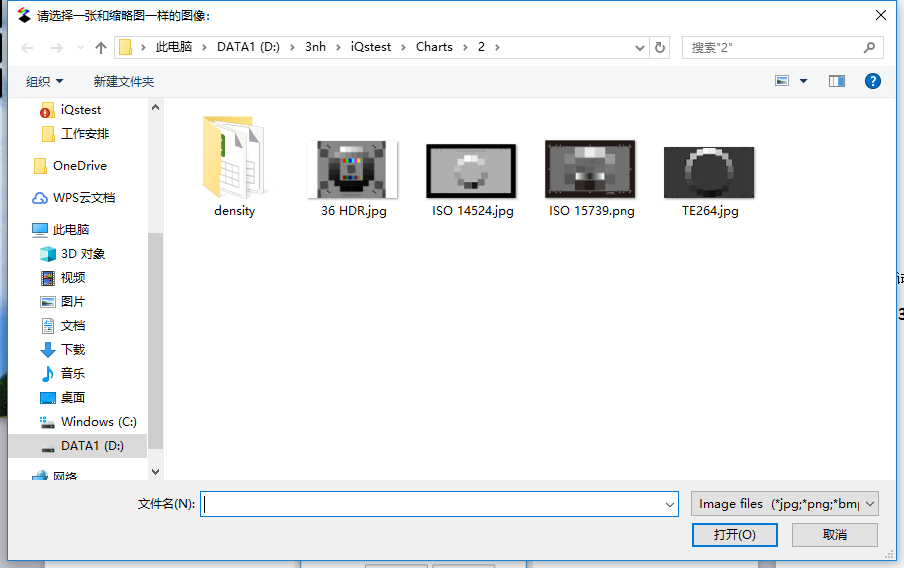
Figure 3.3.3 Test Image SelectionSelect the test image and click "Open" to automatically analyze the image and locate the markers and patches:
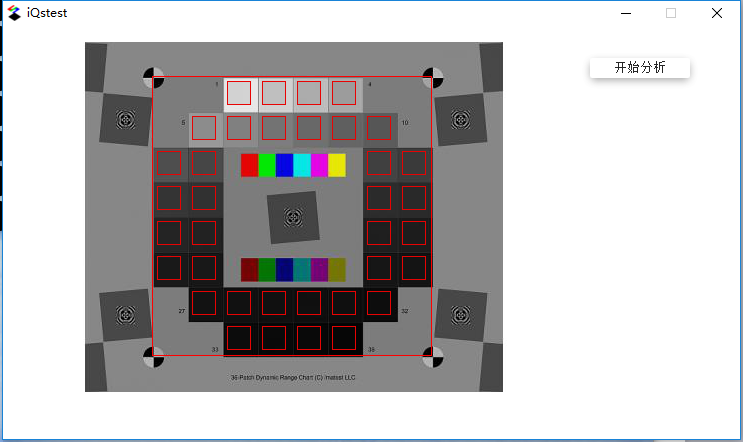
Figure 3.3.4 Automatic AnalysisAs can be seen from the above figure, the automatic analysis is completed and successfully positioned. Click “Start Analysis” to perform dynamic range analysis on the test card. For the analysis of the results, please see the next chapter.
Manual
After selecting the test image, the ROI selection interface will pop up, and you can select the ROI by dragging with the mouse:
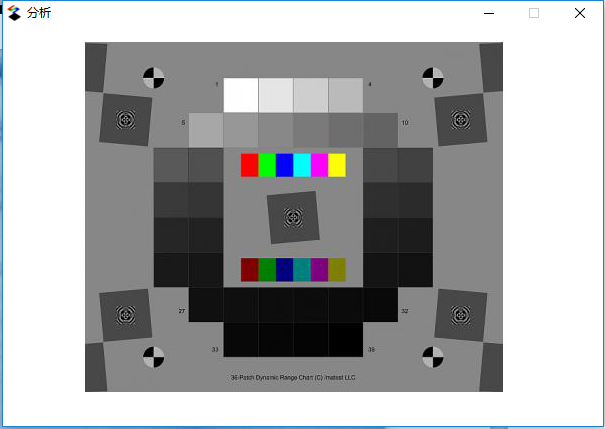
Figure 3.3.5 Manual ROI SelectionAfter the ROI is selected, release the mouse and it will automatically enter the ROI fine-tuning:
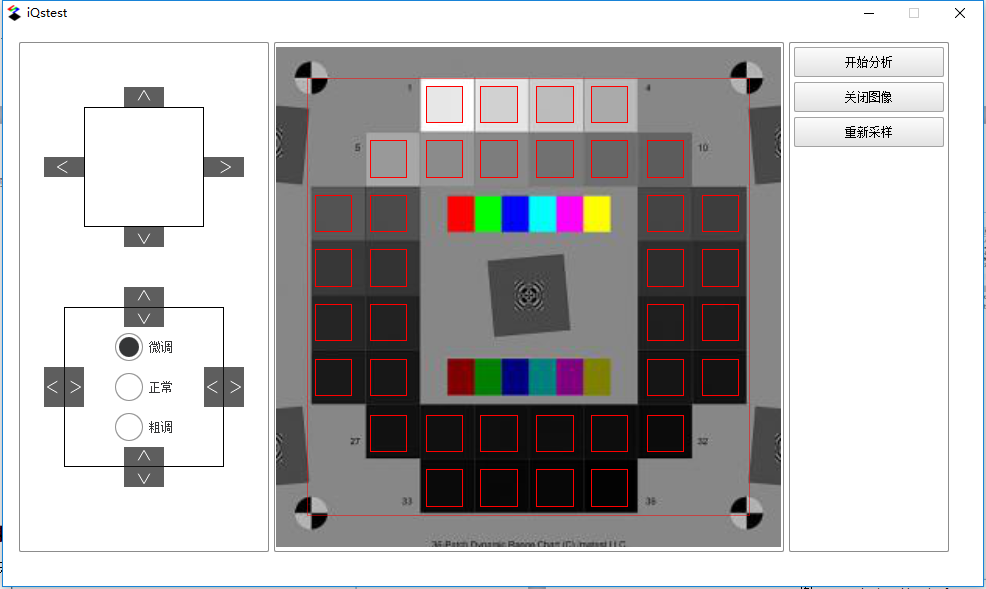
Figure 3.3.6 ROI fine-tuning window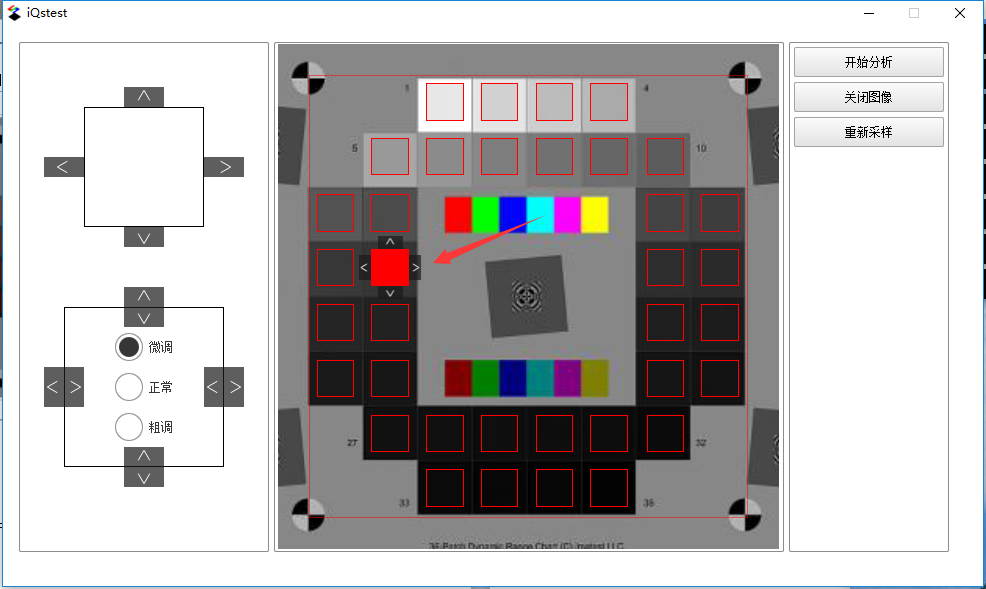
Figure 3.3.7 Small block fine-tuningAs shown in Figure 3.3.7, click the left button of the mouse to adjust the small block. The adjustment button shown in the figure above will pop up. You can adjust the position of a single small block by clicking the adjustment button. The right mouse button will hide the adjustment button.
Result display
Click "Start Analysis", after the analysis is completed, two pages will pop up, as shown below:
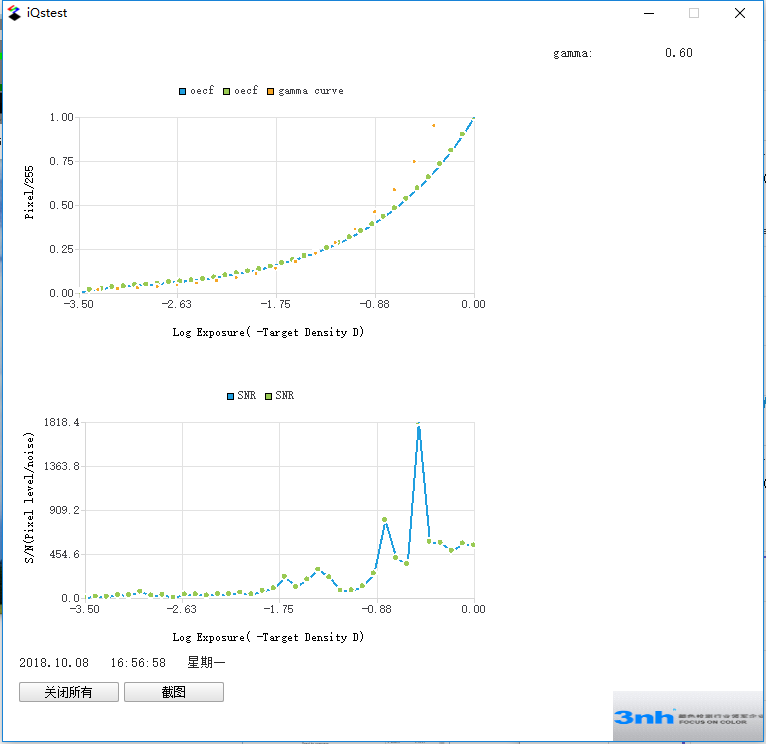
Figure 3.3.8 OECF curve and S/N curve (abscissa is the exposure value)Figure 3.3.8 shows the first page, showing the OECF curve and the S/N curve, and plots the gamma fit curve and the current gamma value.
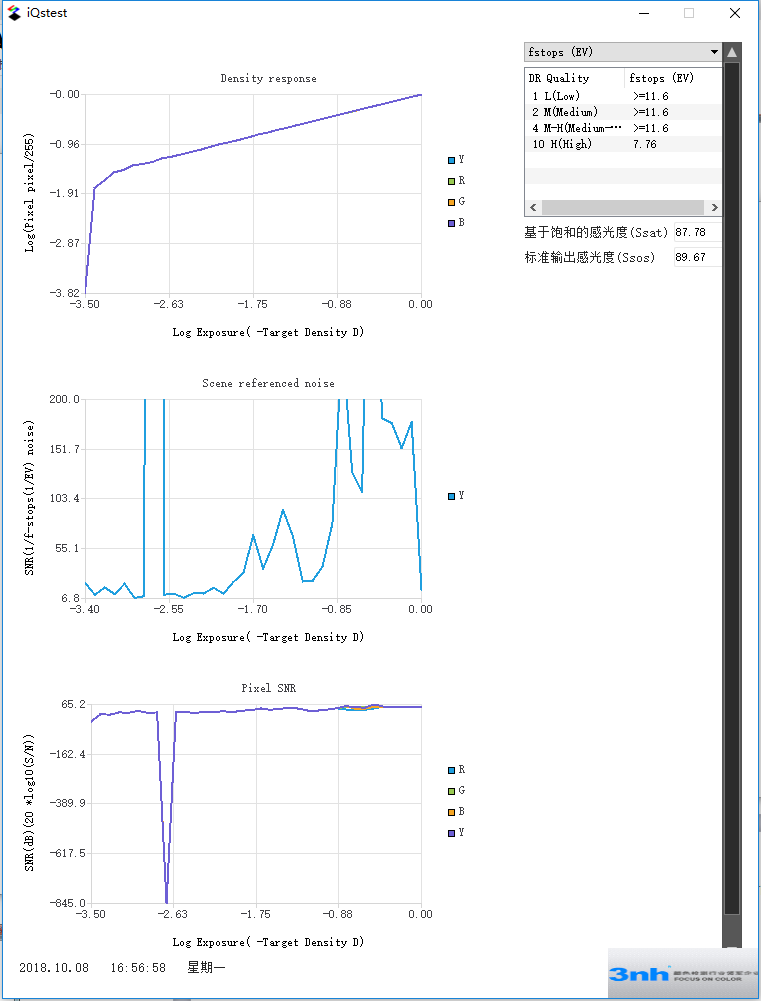
Figure 3.3.9 log(pixel/255), f-stop SNR, SNRFigure 3.3.9 shows the second page, which is the noise analysis result page, showing the f-stop noise curve, SNR (20 log10 (S/N) curve, and evaluating the dynamic range of the image, displayed as a graph. on the right.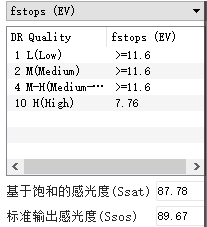
Figure 3.3.10 Dynamic Range IndicatorThe dynamic range indicator values are shown in Figure 3.3.10. The dynamic range is divided into levels (1 L (Low), 2 M (Medium), 4 MH (Medium-High), 10 H (High). It can be seen from the figure that when the dynamic range is high, the maximum allowable noise is 7.76 EV, which is 6.02 * 7.76 = 46.7152 (dB).